9 posts tagged with "performance"

View All Tags

Impact of Camunda Exporter on processing performance

· 5 min read
Christopher Kujawa
Chaos Engineer @ Zeebe

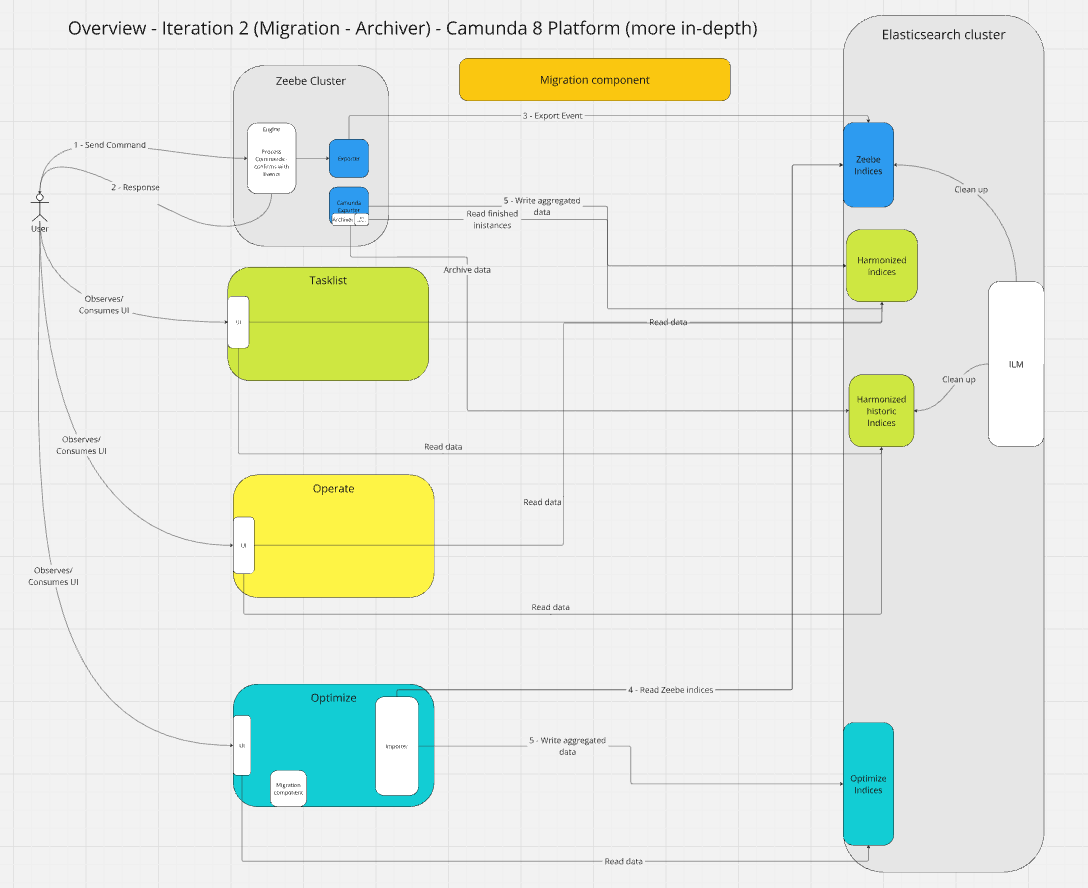
In our last Chaos day we experimented with the Camunda Exporter MVP. After our MVP we continued with Iteration 2, where we migrated the Archiver deployments and added a new Migration component (allows us to harmonize indices).

Additionally, some fixes and improvements have been done to the realistic benchmarks that should allow us to better compare the general performance with a realistic good performing benchmark.

Actually, this is what we want to explore and experiment with today.

  • Does the Camunda Exporter (since the last benchmark) impact performance of the overall system?
    • If so how?
  • How can we potentially mitigate this?

TL;DR; Today's, results showed that enabling the Camunda Exporter causes a 25% processing throughput drop. We identified the CPU as a bottleneck. It seems to be mitigated by either adjusting the CPU requests or removing the ES exporter. With these results, we are equipped to make further investigations and decisions.

Camunda Exporter MVP

· 7 min read
Christopher Kujawa
Chaos Engineer @ Zeebe

After a long pause, I come back with an interesting topic to share and experiment with. Right now we are re-architecture Camunda 8. One important part (which I'm contributing to) is to get rid of Webapps Importer/Archivers and move data aggregation closer to the engine (inside a Zeebe Exporter).

Today, I want to experiment with the first increment/iteration of our so-called MVP. The MVP targets green field installations where you simply deploy Camunda (with a new Camunda Exporter enabled) without Importers.

TL;DR; All our experiments were successful. The MVP is a success, and we are looking forward to further improvements and additions. Next stop Iteration 2: Adding Archiving historic data and preparing for data migration (and polishing MVP).

Camunda Exporter

The Camunda Exporter project deserves a complete own blog post, here is just a short summary.

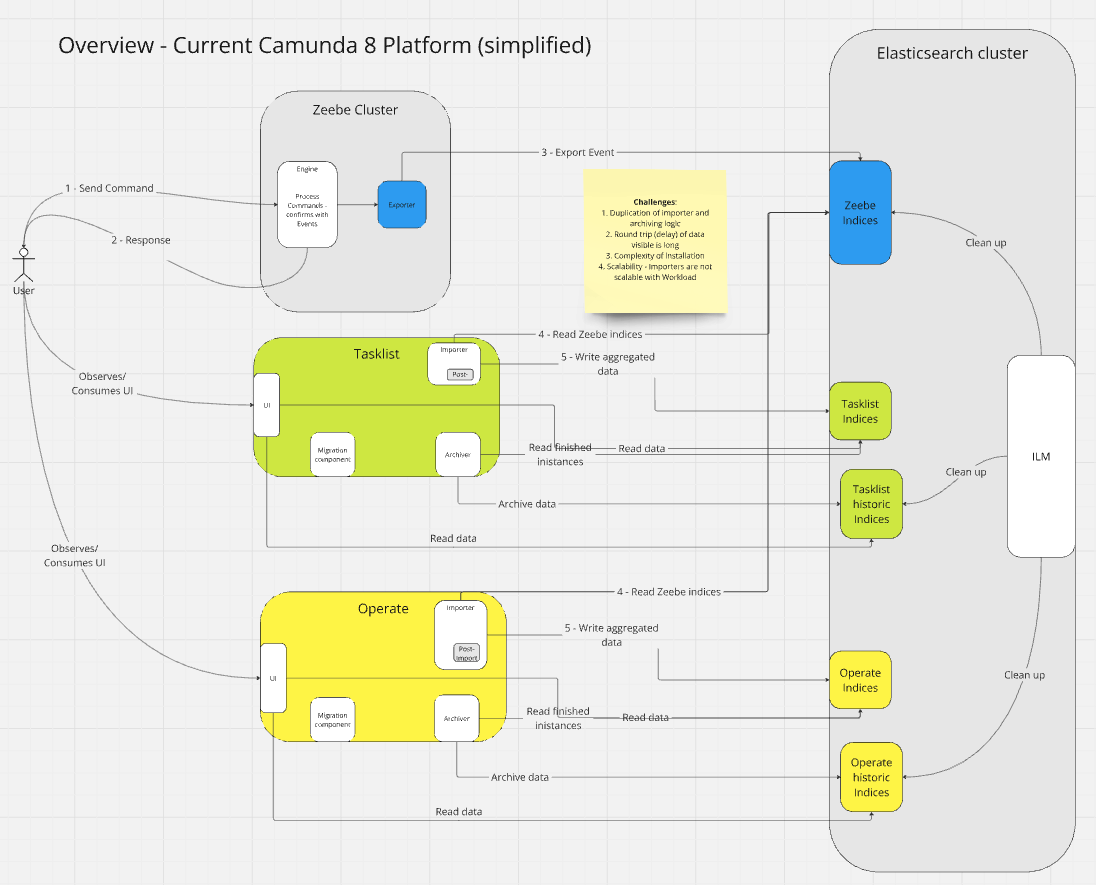
Our current Camunda architecture looks something like this (simplified).

current

It has certain challenges, like:

  • Space: duplication of data in ES
  • Maintenance: duplication of importer and archiver logic
  • Performance: Round trip (delay) of data visible to the user
  • Complexity: installation and operational complexity (we need separate pods to deploy)
  • Scalability: The Importer is not scalable in the same way as Zeebe or brokers (and workload) are.

These challenges we obviously wanted to overcome and the plan (as mentioned earlier) is to get rid of the need of separate importers and archivers (and in general to have separate application; but this is a different topic).

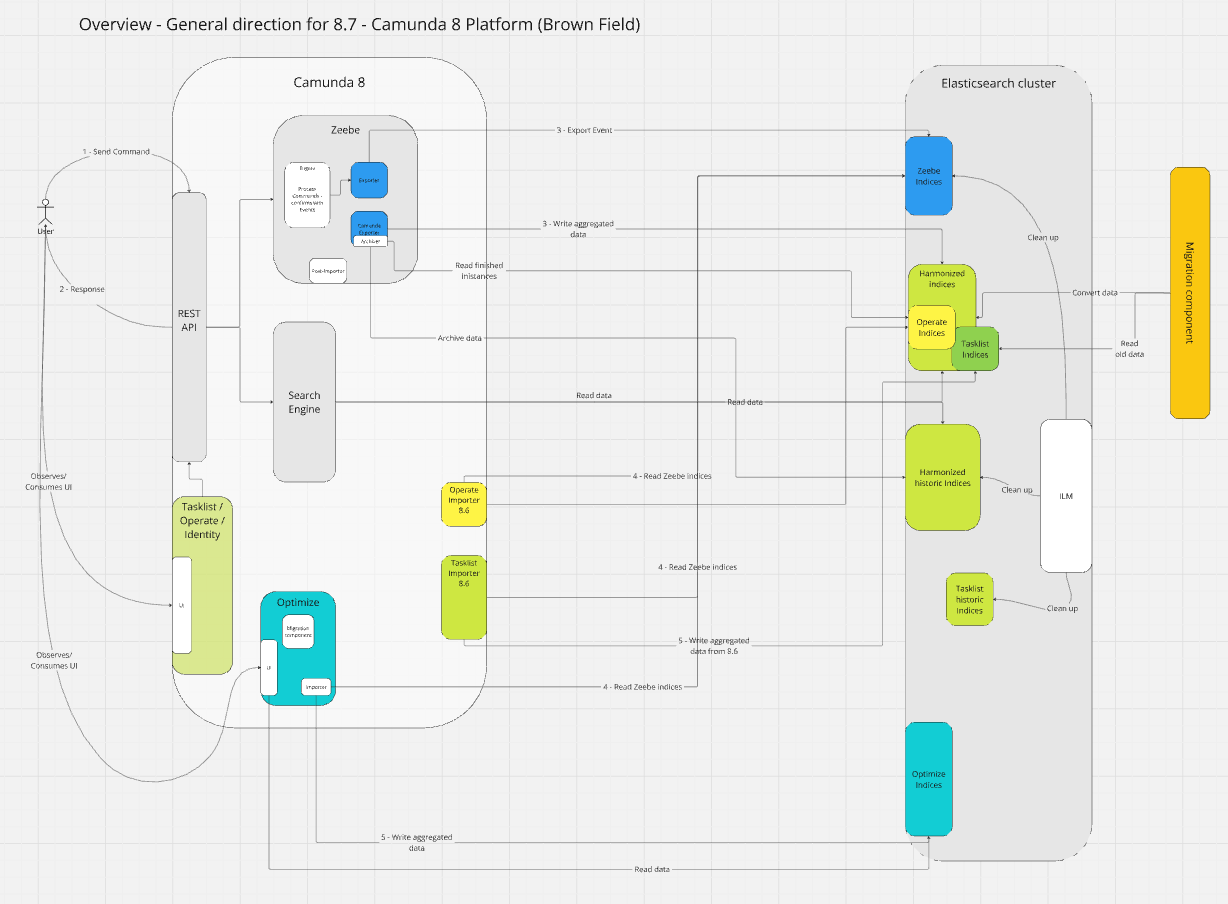
The plan for this project looks something like this:

plan

We plan to:

  1. Harmonize the existing indices stored in Elasticsearch/Opensearch
    • Space: Reduce the unnecessary data duplication
  2. Move importer and archiver logic into a new Camunda exporter
    • Performance: This should allow us to reduce one additional hop (as we don't need to use ES/OS as a queue)
    • Maintenance: Indices and business logic is maintained in one place
    • Scalability: With this approach, we can scale with partitions, as Camunda Exporters are executed for each partition separately (soon partition scaling will be introduced)
    • Complexity: The Camunda Exporter will be built-in and shipped with Zeebe/Camunda 8. No additional pod/application is needed.

Note: Optimize is right now out of scope (due to time), but will later be part of this as well.

MVP

After we know what we want to achieve what is the Minimum viable product (MVP)?

We have divided the Camunda Exporter in 3-4 iterations. You can see and read more about this here.

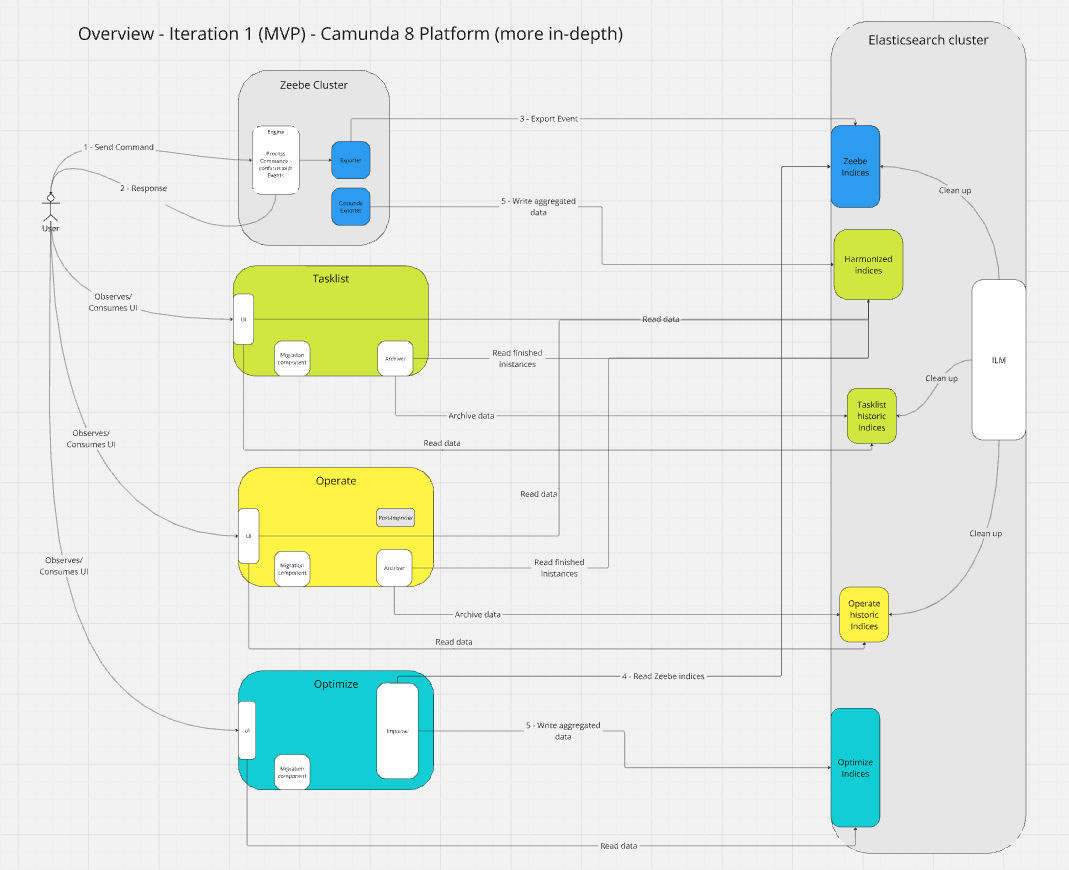
The first iteration contains the MVP (the first breakthrough). Providing the Camunda Exporter with the basic functionality ported from the Operate and Tasklist importers, writing into harmonized indices.

The MVP is targeting green field installations (clean installations) of Camunda 8 with Camunda Exporter without running the old Importer (no data migration yet),

mvp

Optimizing cluster sizing using a real world benchmark

· 7 min read
Rodrigo Lopes
Associate Software Engineer @ Zeebe

Our first goal of this experiment is to use a benchmarks to derive new optimized cluster configuration that can handle at least 100 tasks per second, while maintaining low backpressure and low latency.

For our experiment, we use a newly defined realistic benchmark (with a more complex process model). More about this in a separate blog post.

The second goal is to scale out optimized cluster configuration resources linearly and see if the performance scales accordingly.

TL;DR;

We used a realistic benchmark to derive a new cluster configuration based on previous requirements.

When we scale this base configuration linearly we see that the performance increases almost linearly as well, while maintaining low backpressure and low latency.

Chaos Experiment

Expected

We expect that we can find a cluster configuration that can handle at 100 tasks second to be significantly reduced in resources in relation to our smaller clusters (G3-S HA Plan) since these can process significantly above our initial target.

We also expect that we can scale this base configuration linearly, and that the processing tasks rate to grow initially a bit faster than linearly due to the lower relative overhead, and if we keep expanding further to flatten due to the partition count being a bottleneck.

Actual

Minimal Requirements for our Cluster

Based on known customer usage, and our own previous experiments, we determined that the new cluster would need to create and complete a baseline of 100 tasks per second, or about 8.6 million tasks per day.

Other metrics that we want to preserve and keep track are the backpressure to preserve user experience, guarantee that exporting speed can keep up with the processing speed, write-to-import latency which tells us how long it takes for a record to be written to being imported by our other apps such as the operator.

Reverse Engineering the Cluster Configuration

For our new configurations the only resources that we are going to change are the ones relevant to the factors described above. These are the resources allocated to our zeebe-brokers, gateway and elasticSearch.

Our starting point in resources was the configuration for our G3-S HA Plan as this already had the capability to significantly outperform the current goal of 100 tasks per second.

The next step was to deploy our realistic benchmark, with a payload of 5 customer disputes per instance and start 7 instances per second, this generated approximately 120 tasks per second (some buffer was added to guarantee performance).

After this we reduced the resources iteratively until we saw any increase in backpressure, given that no there was no backlog of records, and no significant increase in the write to import latency.

The results for our new cluster are specified bellow in the tables, where our starting cluster configuration is the G3-S HA Plan and the new configuration cluster is the G3 - BasePackage HA.

G3-S HACPU LimitMemory Limit in GB
operate22
operate.elasticsearch66
optimize22
tasklist22
zeebe.broker2.8812
zeebe.gateway0.90.8
TOTAL15.7824.8
G3 - BasePackage HACPU LimitMemory Limit in GB
operate11
operate.elasticsearch34.5
optimize11.6
tasklist11
zeebe.broker1.54.5
zeebe.gateway0.61
TOTAL8.113.6
Reduction in Resources for our Optimized Cluster
CPU Reduction (%)Memory Reduction (%)
zeebe.broker47.9262.5
zeebe.gateway33.33-25.0
operate.elasticsearch50.0025.0

Total cluster reduction:

G3-S HAG3 - BasePackage HAReduction (%)
CPU Limits15.788.149
Memory Limits24.813.645

The process of reducing the hardware requirements was donne initially by scaling down the resources of the zeebe-broker, gateway and elasticSearch. The other components were left untouched, as they had no impact in our key metrics, and were scaled down later in separate experiences to maintain user experience.

Scaling out the Cluster

Now for the scaling procedure we intend to see if we can linearly increase the allocated resources and having a corresponding performance increase, while keeping the backpressure low, low latency, and user experience.

For this we started with the G3 - BasePackage HA configuration and incremented the load again until we saw any increase in backpressure, capture our key metrics and repeated the process for the cluster configuration resources respectively multiplied by 2x, 3x, and 4x.

This means that the resources allocated for our clusters were:

Base 1xBase 2xBase 3xBase 4x
CPU Limits8.717.426.134.8
Memory Limits14.929.844.759.6

The results in the table bellow show the performance of our several cluster configurations:

Base 1xBase 2xBase 3xBase 4x
Process Instances/s7122327
Tasks/s125217414486
Average Backpressure2%2%3%6%
Write-to-Import Latency90s120s150s390s
Write-to-Process Latency140ms89ms200ms160ms
Records Processed Rate25004700780011400
Records Exported Rate2100390065009200

This first observations is that the performance scales particularly well by just adding more resources to the cluster, particularly for a linear increase of the resources the performance as measured by tasks completed increases slightly less than linearly (comparing the 1x and 4x task/s we get 388% the initial rate).

This a very good result as it means that we can scale our system linearly (at least initially) to handle the expected increase in loads.

Importantly, the backpressure is kept low, and the write-to-import latency only increases significantly if we leave the cluster running at max rate for long periods of time. For slightly lower rates the write-to-import latency is kept in the single digits of seconds or lower tens. This might imply that a these sustained max rates, the amount records generated starts to be too much for either ElasticSearch or our web apps that import these records to handle. Some further investigation could be done here to investigate the bottleneck.

Another metric also relevant but not shown in this table is the backlog of records not exported, which kept at almost null through all the experiments conducted.

Bugs found

During the initial tests, we had several OOM errors in the gateways pods. After some investigation, we found that this was exclusive to the Camunda 8. 6.0 version, which consumes more memory in the gateway than the previous versions. This explains why the gateway memory limits were the only resource that was increased in the new reduced cluster configuration.
Improve Operate import latency

· 9 min read
Christopher Kujawa
Chaos Engineer @ Zeebe

In our last Chaos Day we experimented with Operate and different load (Zeebe throughput). We observed that a higher load caused a lower import latency in Operate. The conclusion was that it might be related to Zeebe's exporting configuration, which is affected by a higher load.

In today's chaos day we want to verify how different export and import configurations can affect the importing latency.

TL;DR; We were able to decrease the import latency by ~35% (from 5.7 to 3.7 seconds), by simply reducing the bulk.delay configuration. This worked on low load and even higher load, without significant issues.

Operate load handling

· 8 min read
Christopher Kujawa
Chaos Engineer @ Zeebe

🎉 Happy to announce that we are broadening the scope of our Chaos days, to look holistically at the whole Camunda Platform, starting today. In the past Chaos days we often had a close look (or concentrated mostly) at Zeebe performance and stability.

Today, we will look at the Operate import performance and how Zeebe processing throughput might affect (or not?) the throughput and latency of the Operate import. Is it decoupled as we thought?

The import time is an important metric, representing the time until data from Zeebe processing is visible to the User (excluding Elasticsearch's indexing). It is measured from when the record is written to the log, by the Zeebe processor, until Operate reads/imports it from Elasticsearch and converts it into its data model. We got much feedback (and experienced this on our own) that Operate is often lagging behind or is too slow, and of course we want to tackle and investigate this further.

The results from this Chaos day and related benchmarks should allow us to better understand how the current importing of Operate performs, and what its affects. Likely it will be a series of posts to investigate this further. In general, the data will give us some guidance and comparable numbers for the future to improve the importing time. See also related GitHub issue #16912 which targets to improve such.

TL;DR; We were not able to show that Zeebe throughput doesn't affect Operate importing time. We have seen that Operate can be positively affected by the throughput of Zeebe. Surprisingly, Operate was faster to import if Zeebe produced more data (with a higher throughput). One explanation of this might be that Operate was then less idle.

Broker Scaling and Performance

· 6 min read
Lena Schönburg
Senior Software Engineer @ Zeebe
Deepthi Akkoorath
Senior Software Engineer @ Zeebe

With Zeebe now supporting the addition and removal of brokers to a running cluster, we wanted to test three things:

  1. Is there an impact on processing performance while scaling?
  2. Is scaling resilient to high processing load?
  3. Can scaling up improve processing performance?

TL;DR; Scaling up works even under high load and has low impact on processing performance. After scaling is complete, processing performance improves in both throughput and latency.

Dynamically scaling brokers

· 7 min read
Lena Schönburg
Senior Software Engineer @ Zeebe

We experimented with the first version of dynamic scaling in Zeebe, adding or removing brokers for a running cluster.

Scaling up and down is a high-level operation that consists of many steps that need to be carried co-operatively by all brokers in the cluster. For example, adding new brokers first adds them to the replication group of the assigned partitions and then removes some of the older brokers from the replication group. Additionally, priorities need to be reconfigured to ensure that the cluster approaches balanced leadership eventually.

This orchestration over multiple steps ensures that all partitions are replicated by at least as many brokers as configured with the replicationFactor. As always, when it comes to orchestrating distributed systems, there are many edge cases and failure modes to consider.

The goal of this experiment was to verify that the operation is resilient to broker restarts. We can accept that operations take longer than usual to complete, but we need to make sure that the operation eventually succeeds with the expected cluster topology as result.

TL;DR; Both scaling up and down is resilient to broker restarts, with the only effect that the operation takes longer than usual to complete.

Worker count should not impact performance

· 3 min read
Christopher Kujawa
Chaos Engineer @ Zeebe

In this chaos day we experimented with the worker count, since we saw recently that it might affect the performance (throughput) negatively if there are more workers deployed. This is related to #7955 and #8244.

We wanted to prove, that even if we have more workers deployed the throughput of the process instance execution should not have an negative impact.

TL;DR; We were not able to prove our hypothesis. Scaling of workers can have a negative impact on performance. Check out the third chaos experiment.

Throughput on big state

· 4 min read
Christopher Kujawa
Chaos Engineer @ Zeebe

In this chaos day we wanted to prove the hypothesis that the throughput should not significantly change even if we have bigger state, see zeebe-chaos#64

This came up due observations from the last chaos day. We already had a bigger investigation here zeebe#7955.

TL;DR; We were not able to prove the hypothesis. Bigger state, more than 100k+ process instances in the state, seems to have an big impact on the processing throughput.