Christopher Kujawa
Chaos Engineer @ Zeebe
View all authors

Impact of Camunda Exporter on processing performance

· 5 min read
Christopher Kujawa
Chaos Engineer @ Zeebe

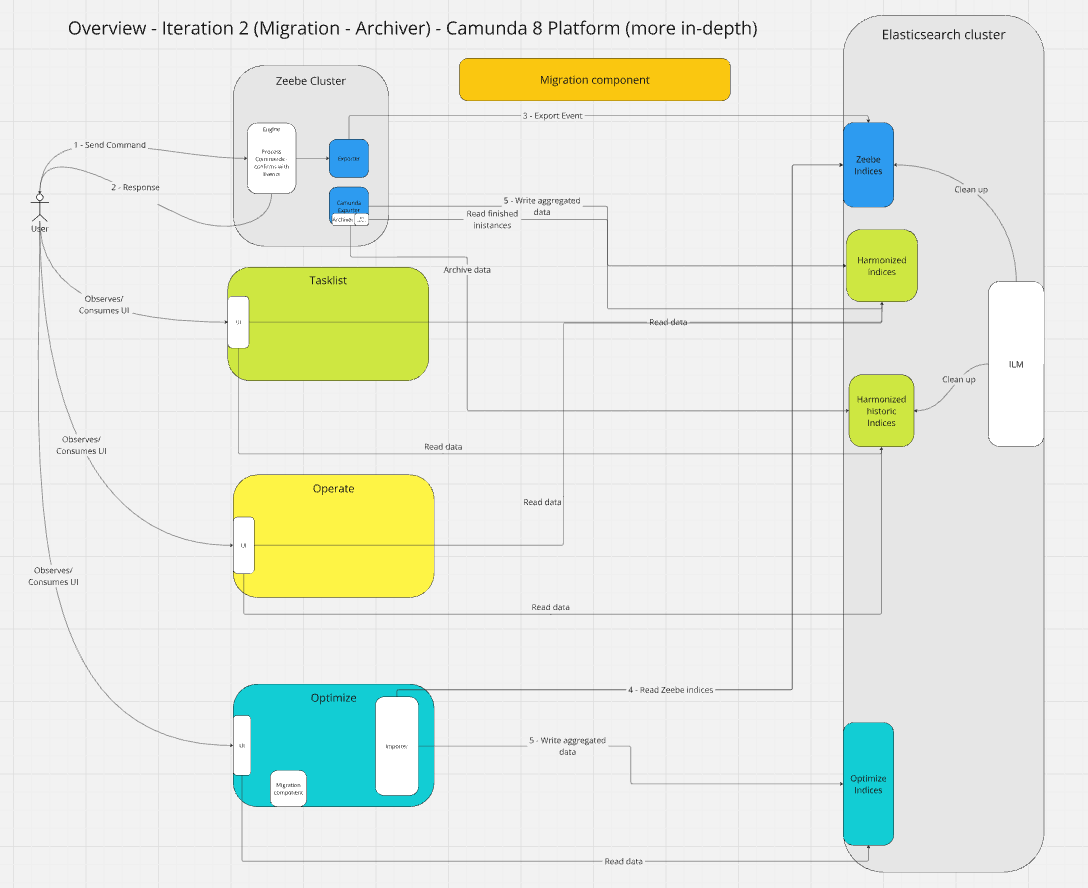
In our last Chaos day we experimented with the Camunda Exporter MVP. After our MVP we continued with Iteration 2, where we migrated the Archiver deployments and added a new Migration component (allows us to harmonize indices).

Additionally, some fixes and improvements have been done to the realistic benchmarks that should allow us to better compare the general performance with a realistic good performing benchmark.

Actually, this is what we want to explore and experiment with today.

  • Does the Camunda Exporter (since the last benchmark) impact performance of the overall system?
    • If so how?
  • How can we potentially mitigate this?

TL;DR; Today's, results showed that enabling the Camunda Exporter causes a 25% processing throughput drop. We identified the CPU as a bottleneck. It seems to be mitigated by either adjusting the CPU requests or removing the ES exporter. With these results, we are equipped to make further investigations and decisions.

Camunda Exporter MVP

· 7 min read
Christopher Kujawa
Chaos Engineer @ Zeebe

After a long pause, I come back with an interesting topic to share and experiment with. Right now we are re-architecture Camunda 8. One important part (which I'm contributing to) is to get rid of Webapps Importer/Archivers and move data aggregation closer to the engine (inside a Zeebe Exporter).

Today, I want to experiment with the first increment/iteration of our so-called MVP. The MVP targets green field installations where you simply deploy Camunda (with a new Camunda Exporter enabled) without Importers.

TL;DR; All our experiments were successful. The MVP is a success, and we are looking forward to further improvements and additions. Next stop Iteration 2: Adding Archiving historic data and preparing for data migration (and polishing MVP).

Camunda Exporter

The Camunda Exporter project deserves a complete own blog post, here is just a short summary.

Our current Camunda architecture looks something like this (simplified).
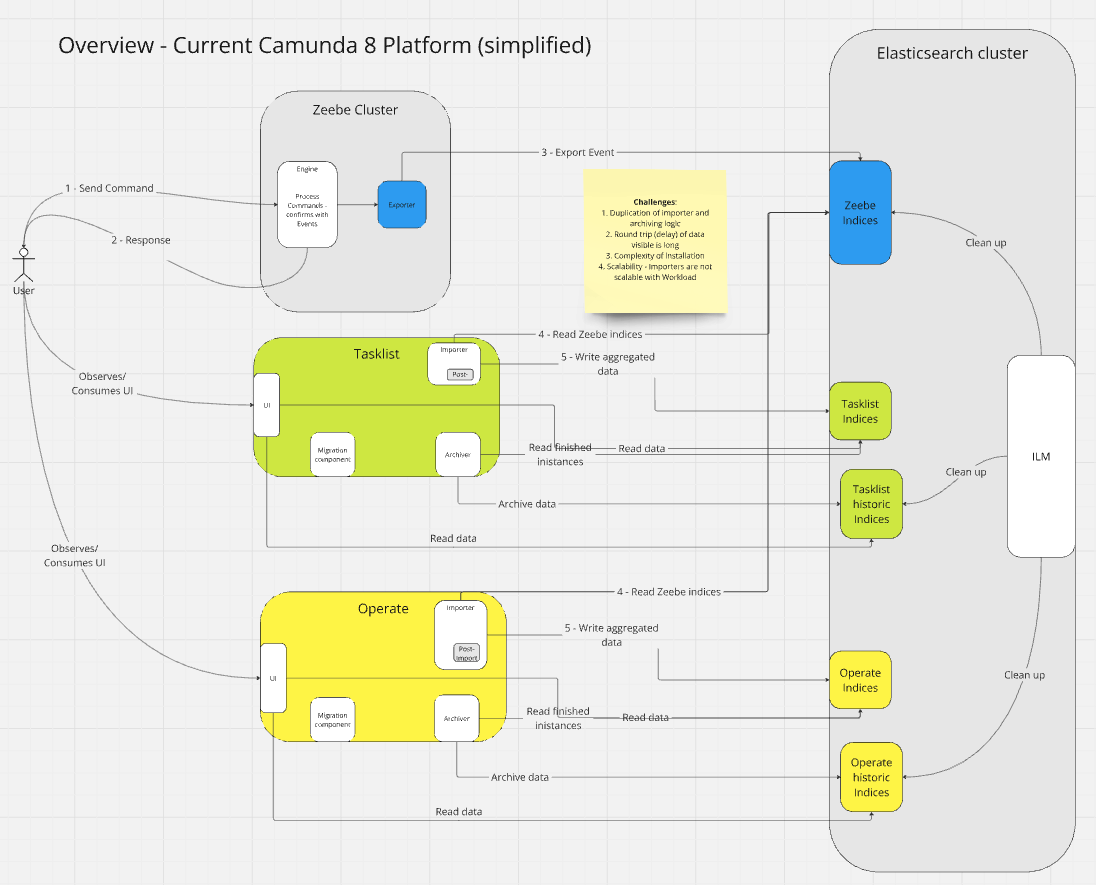
current

It has certain challenges, like:

  • Space: duplication of data in ES
  • Maintenance: duplication of importer and archiver logic
  • Performance: Round trip (delay) of data visible to the user
  • Complexity: installation and operational complexity (we need separate pods to deploy)
  • Scalability: The Importer is not scalable in the same way as Zeebe or brokers (and workload) are.

These challenges we obviously wanted to overcome and the plan (as mentioned earlier) is to get rid of the need of separate importers and archivers (and in general to have separate application; but this is a different topic).

The plan for this project looks something like this:
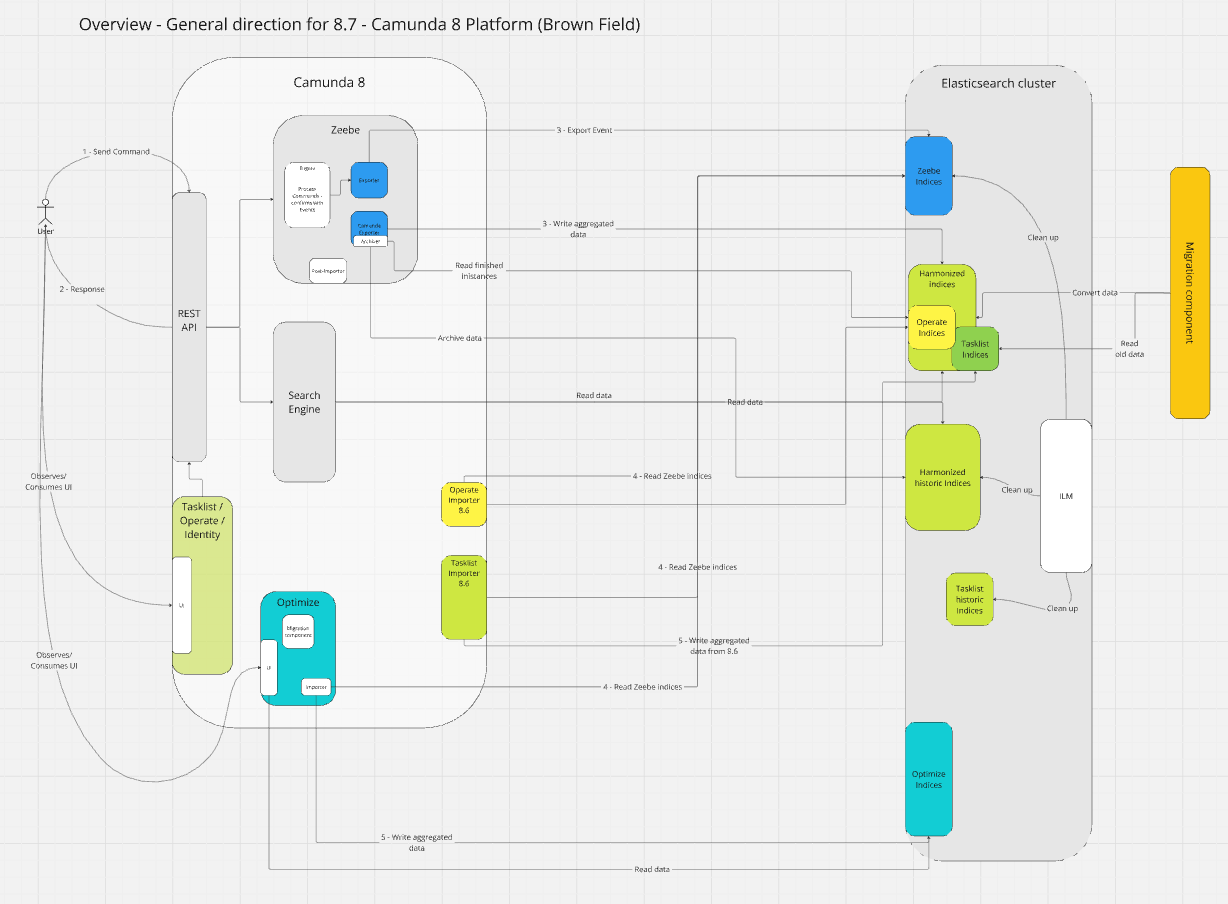
plan

We plan to:

  1. Harmonize the existing indices stored in Elasticsearch/Opensearch
    • Space: Reduce the unnecessary data duplication
  2. Move importer and archiver logic into a new Camunda exporter
    • Performance: This should allow us to reduce one additional hop (as we don't need to use ES/OS as a queue)
    • Maintenance: Indices and business logic is maintained in one place
    • Scalability: With this approach, we can scale with partitions, as Camunda Exporters are executed for each partition separately (soon partition scaling will be introduced)
    • Complexity: The Camunda Exporter will be built-in and shipped with Zeebe/Camunda 8. No additional pod/application is needed.

Note: Optimize is right now out of scope (due to time), but will later be part of this as well.

MVP

After we know what we want to achieve what is the Minimum viable product (MVP)?

We have divided the Camunda Exporter in 3-4 iterations. You can see and read more about this here.

The first iteration contains the MVP (the first breakthrough). Providing the Camunda Exporter with the basic functionality ported from the Operate and Tasklist importers, writing into harmonized indices.

The MVP is targeting green field installations (clean installations) of Camunda 8 with Camunda Exporter without running the old Importer (no data migration yet),
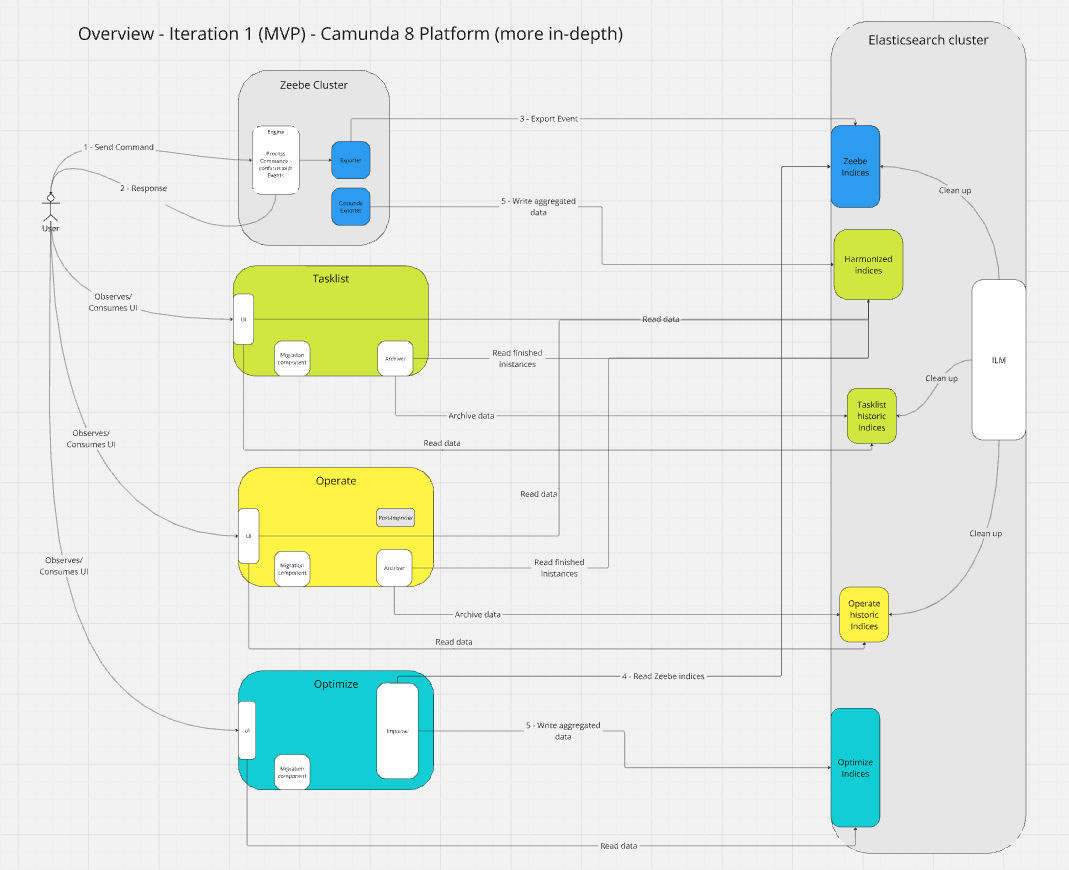
mvp

Improve Operate import latency

· 9 min read
Christopher Kujawa
Chaos Engineer @ Zeebe

In our last Chaos Day we experimented with Operate and different load (Zeebe throughput). We observed that a higher load caused a lower import latency in Operate. The conclusion was that it might be related to Zeebe's exporting configuration, which is affected by a higher load.

In today's chaos day we want to verify how different export and import configurations can affect the importing latency.

TL;DR; We were able to decrease the import latency by ~35% (from 5.7 to 3.7 seconds), by simply reducing the bulk.delay configuration. This worked on low load and even higher load, without significant issues.

Operate load handling

· 8 min read
Christopher Kujawa
Chaos Engineer @ Zeebe

🎉 Happy to announce that we are broadening the scope of our Chaos days, to look holistically at the whole Camunda Platform, starting today. In the past Chaos days we often had a close look (or concentrated mostly) at Zeebe performance and stability.

Today, we will look at the Operate import performance and how Zeebe processing throughput might affect (or not?) the throughput and latency of the Operate import. Is it decoupled as we thought?

The import time is an important metric, representing the time until data from Zeebe processing is visible to the User (excluding Elasticsearch's indexing). It is measured from when the record is written to the log, by the Zeebe processor, until Operate reads/imports it from Elasticsearch and converts it into its data model. We got much feedback (and experienced this on our own) that Operate is often lagging behind or is too slow, and of course we want to tackle and investigate this further.

The results from this Chaos day and related benchmarks should allow us to better understand how the current importing of Operate performs, and what its affects. Likely it will be a series of posts to investigate this further. In general, the data will give us some guidance and comparable numbers for the future to improve the importing time. See also related GitHub issue #16912 which targets to improve such.

TL;DR; We were not able to show that Zeebe throughput doesn't affect Operate importing time. We have seen that Operate can be positively affected by the throughput of Zeebe. Surprisingly, Operate was faster to import if Zeebe produced more data (with a higher throughput). One explanation of this might be that Operate was then less idle.

Job push resiliency

· 7 min read
Christopher Kujawa
Chaos Engineer @ Zeebe
Nicolas Pepin-Perreault
Senior Software Engineer @ Zeebe

In today's chaos day we experimented with job push resiliency.

The following experiments we have done today:

  1. Job streams should be resilient to gateway restarts/crash
  2. Job streams should be resilient to leadership changes/leader restarts
  3. Job streams should be resilient to cluster restarts

TL;DR; All experiments succeeded and showcased the resiliency even on component restarts. 🚀

Job push overloading

· 6 min read
Christopher Kujawa
Chaos Engineer @ Zeebe
Nicolas Pepin-Perreault
Senior Software Engineer @ Zeebe

In today's chaos day we (Nicolas and I) want to verify how job push behaves and in general, the Zeebe system when we have slow workers.

TL;DR; Right now it seems that even if we have a slow worker it doesn't impact the general system, and only affects the corresponding process instance, not other instances. We found no unexpected issues, everything performed pretty well.

Hot backups impact on processing

· 4 min read
Christopher Kujawa
Chaos Engineer @ Zeebe

Today, we want to experiment with hot backups in SaaS and a larger runtime state in Zeebe and how it impacts the ongoing processing in Zeebe (or not?). This is part of the investigation of a recently created bug issue we wanted to verify/reproduce #14696.

TL;DR; We were able to prove that hot backups are indeed not impacting overall processing throughput in Zeebe. We found that having a full Elasticsearch disk might impact or even fail your backups, which is intransparent to the user.

Using Large Multi-Instance

· 6 min read
Christopher Kujawa
Chaos Engineer @ Zeebe

New day new chaos. 💀 In today's chaos day I want to pick up a topic, which had bothered people for long time. I created a chaos day three years ago around this topic as well.

Today, we experiment with large multi-instances again. In the recent patch release 8.2.5 we fixed an issue with spawning larger multi instances. Previously if you have created a process instance with a large multi-instance it was likely that this caused to blacklist the process instance, since the multi-instance spawning ran into maxMessageSize limitations.

This means the process instance was stuck and was no longer executable. In Operate this was not shown and caused a lot of friction or confusion to users. With the recent fix, Zeebe should chunk even large collections into smaller batches to spawn/execute the multi-instance without any issues.

TL;DR; We were able to see that even large multi-instances can be executed now. At some point, we experienced performance regressions (during creating new multi-instance elements) but the execution of the process instance doesn't fail anymore. One problem at a time, we will likely investigate further to improve the performance of such a use case.

When we reached the maxMessageSize we got a rejection, if the input collection is too large we see some weird unexpected errors from NGINX.

Continuing SST Partitioning toggle

· 9 min read
Christopher Kujawa
Chaos Engineer @ Zeebe

Today we want to continue with the experiment from last Chaos day, but this time with a bit more load. This should make sure that we trigger the compaction of RocksDB and cause the SST partitioning to happen, for real.

The reasons stay the same we want to find out whether it would be possible to enable and disable the flag/configuration without issues.

TL;DR; Today's, experiments succeeded 🚀. We were able to show that even with a higher number of process instances (bigger state) we can easily disable and enable the SST partitioning flag without issues. I also got a confirmation from a RocksDb contributor that our observations are correct, and that we can easily toggle this feature without issues.

SST Partitioning toggle

· 7 min read
Christopher Kujawa
Chaos Engineer @ Zeebe

On this chaos day I wanted to experiment with a new experimental feature we have released recently. The enablement of the partitioning of the SST files in RocksDB. This is an experimental feature from RocksDb, which we made available now for our users as well, since we have seen great benefits in performance, especially with larger runtime data.

I wanted to experiment a bit with the SST partitioning and find out whether it would be possible to enable and disable the flag/configuration without issues.

TL;DR; The first experiment was successful, it looks like we can enable and disable the partitioning without impacting the execution of one existing PI. We need to experiment a bit more with larger data sets to force RocksDB compaction, to be fully sure.